Question: Describe a graph showing the number of people using the internet from the year 2014 to 2018 in Bangladesh in 150 words. You should highlight and summarize the information given in the graph.
Answer:
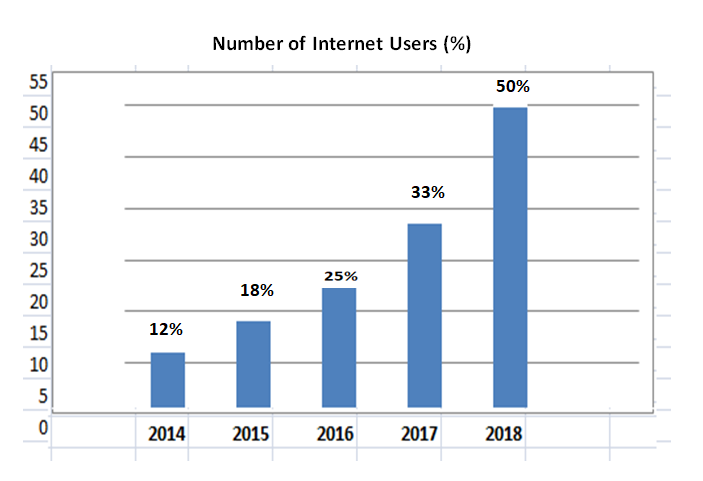
The graph shows data on the number of internet users in Bangladesh from 2014 to 2018. At a glance, we see here a growing trend of internet users every year.
From the given information of the graph in 2014, only 12% of the people used the internet. This figure gradually rose to 18% in 2015. This increasing trend continues even in the next years as well. The percentage of internet users was 18% in 2015 and 25% in 2016 respectively. From 2017 to 2018 there was also a steady increase in the number of internet users and the percentages were 33% and 50% respectively. Among the other mentioned years, a rapid increase is observed from 2017 to 2018.
As the Internet enriches every aspect of human life, people become more interested in using the Internet. This clause is equally applicable to Bangladesh. The steady increase in the number of Internet users from 1914 to 18 in the chart supports this point.
Related term :
How to write a graph or chart effectively
Describe the pie chart showing the percentage of family’s expenditure